Urban Data & Analysis Services
Services
Data analysis, mapping, and data systems support for organizations working on cities, housing, and the built environment.
I work with consultancies, associations, not-for-profits, and public agencies that need analytical capacity for a project short of a full-time hire. You bring the question; I bring the methods, the visualizations, and a deliverable your team can reuse independently.
Book a free scoping call →Offerings
01
Research & analysis
What you get
A brief, memo, or report chapter with documented methods and reusable data.
Typical requests
- Housing supply and density studies
- Transit access analysis
- Market and development scans
- Tall-building research
02
Maps & data visualization
What you get
Publication-ready static maps and charts, or interactive pieces for the web.
Typical requests
- Figures for reports and submissions
- Interactive maps and StoryMaps
- Explanatory graphics for public audiences
03
Data systems for small teams
What you get
Cleaned databases, dashboards, and lightweight internal tools your staff can maintain themselves.
Typical requests
- Lightweight program databases
- KPI dashboards
- Website and platform fixes
- Practical AI adoption
Types of Engagement
Fixed-scope project
A defined deliverable at a fixed fee, usually two to eight weeks.
Monthly retainer
A set number of hours each month for ongoing analysis or systems support.
Subcontract
Analysis and mapping, delivered under your firm's brand and inside your project timeline.
Every engagement starts with a free 30-minute scoping call and a one-page brief with a price.
- 1
Scoping call
Thirty minutes for free. We talk through the question, what data you have, and the decision it needs to support.
- 2
One-page brief
A short written scope with deliverables, timeline, and a fixed cost, so there are no surprises.
- 3
Analysis & check-ins
Work happens in the open, with short check-ins so the output stays pointed at what you actually need.
- 4
Handoff
Final deliverables plus clean data and documented methods, so your team can reuse and extend the work.
Selected work
Full portfolio →
Cartomoir
A travel-mapping app that turns every flight, drive, train ride, and hike into colour-coded routes on one map, with distance stats and visited regions.
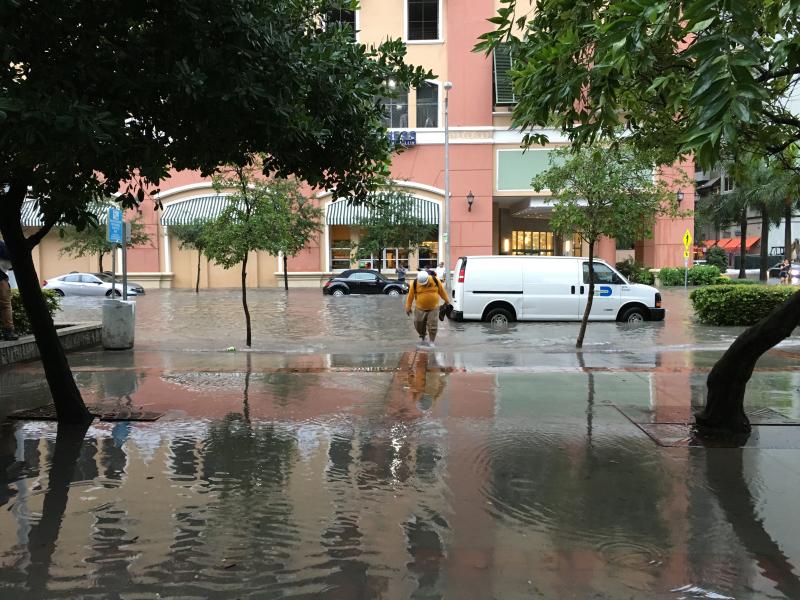
Sea-Level Rise Susceptibility: Miami
A StoryMap I authored on navigating rising waters in a rapidly developing downtown, mapping flood exposure against Miami’s booming tall-building pipeline.

The World’s Highest Pools
A global audit I co-authored of pools in the world’s 200 supertall buildings (108 of which have one) and the research behind the CTBUH’s formal definition of an “infinity pool.”
About me
I'm the Associate Director of CVU Canada (Council on Vertical Urbanism), where I established and co-lead the Canadian research office of the Council at Toronto Metropolitan University. Before that, I was a building data analyst at the Council's Chicago headquarters, maintaining The Skyscraper Center, the world's largest tall-building database. I also write and am occasionally interviewed on Toronto planning issues.
- Education
- Master of Urban Planning & Policy and Master of Public Administration, University of Illinois Chicago; postgraduate certificates in geospatial analysis and public transit management.
- Professional standing
- Candidate member, OPPI, working toward the RPP designation.
- Tools
- Python, SQL (PostgreSQL and MySQL), ArcGIS / QGIS, Data Visualization.
Do you have a question your data should be able to answer?
Let's chat about what you're working on. I'll provide a clearer sense of what's possible, whether or not we work together.
Start a conversation →